


Arlington Bike Counters During SafeTrack


Curious how Metrorail's SafeTrack initiative affected biking in the County? Read below to see the data on the trails.
Updated July 20, 2016: Corrections to table data
With four surges of SafeTrack completed, we are starting to see some patterns emerge when it comes to the effect the Metro maintenance program is having on the bike traffic in Arlington. The bottom line is the numbers are up compared to recent years, but there has been some fluctuation.
Surge 1 Caused a Big Surge in Bikes
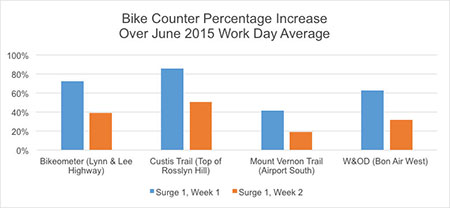
As we reported in an earlier post, during Surge 1, with single tracking on the Orange/Silver line between East Falls Church and Ballston, the work week of June 6-10 saw record ridership, with daily average bike ridership at four select counters ranging from 42%-86% over the June 2015 work week average. Those ranges slipped slightly in the second week, June 13-17, to a range of 19%-50% over 2015.
Graph 1: Bike Counter Percentage Increase Over June 2015, Surge 1
Rates in Surge 2 Start Coming Back to Normal
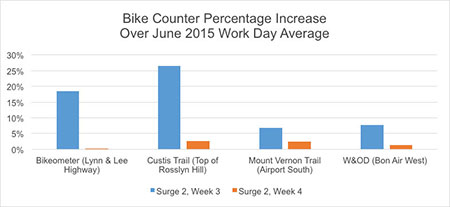
With the start of Surge 2, which feature SafeTrack’s first complete line closures on the Orange/Silver line between Benning Road and Eastern Market, and on the Blue line between Arlington Cemetery and Rosslyn, much of the attention shifted away from Arlington even though service in the Rosslyn-Ballston corridor was to be down 43%. Bike ridership at the four counters dipped to a range of just 7%-26% over 2015 in Week 3 (June 20-24), and was pretty flat in Week 4 (June 27-July 1) with a range increase of 0%-3%.
Graph 2: Bike Counter Percentage Increase Over June 2015, Surge 2
Surge 3 Saw a Big Shift toward the Blue/Yellow Line
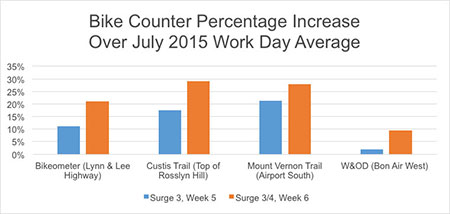
Following the Independence Day break, Surge 3 with complete closures of the Blue/Yellow line from Braddock Road to National Airport, track work shifted back to Northern Virginia. Bike ridership in Arlington jumped again, though not nearly as high as during Surge 1, with daily average increases over 2015 ranging from 2%-21%. Interestingly for the first time since SafeTrack began, the highest increase in Arlington was along the Mt. Vernon Trail and not the Custis. In fact, on July 6, the first day of Surge 3, the Mt. Vernon Trail-Airport South counter posted 3,350 riders, the most on any work day since SafeTrack began a month earlier, 47% more than the July 2015 work day average of 2,285.
And with Surge 4 shifting the Blue/Yellow track closure north, from National Airport to Pentagon City, bike rates increase significantly at all four counters, with increases in daily averages ranging from 9%-29%.
Graph 3: Bike Counter Percentage Increase Over June 2015, Surges 3 and 4
Looking at the six weeks together, the amount of increased bike ridership has definitely slowed, but it remains high and seems to be reactive to SafeTrack work.
Graph 4: Bike Counter Percentage Increase Over June 2015, Weeks 1-6 of SafeTrack
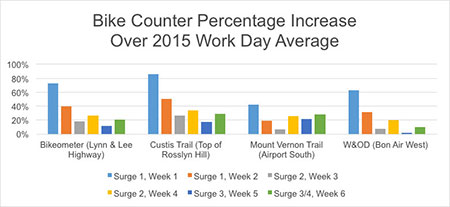
Finally, the work week daily averages from each of the first six weeks of SafeTrack have been among the highest totals in the past two years. Looking at the top ten weeks since 2014 (when the Bikeometer was installed), three of the four counters had multiple weeks in during SafeTrack make their lists, including the top three on the Custis and Mt. Vernon trail counters.
Top 10 in Bike Ridership at Select Arlington Trail Counters (since April 2014)
Rosslyn Bikeometer (Custis)
| Dates | Week Total | Daily Avg. | % Change Over Next Highest |
|
|---|---|---|---|---|
| 1 | June 6-10, 2016 (Surge 1) | 11,537 | 2,307 | 23.89% |
| 2 | June 13-17, 2016 (Surge 1) | 9,312 | 1,862 | 4.99% |
| 3 | May 11-15, 2015 | 8,869 | 1,774 | 3.95% |
| 4 | July 11-15, 2016 (Surge 4) | 8,532 | 1,706 | 0.98% |
| 5 | June 27-July 1, 2016 (Surge 2) | 8,449 | 1,690 | 0.06% |
| 6 | June 2-6, 2014 | 8,444 | 1,689 | 1.43% |
| 7 | May 23-27, 2016 | 8,325 | 1,665 | 2.64% |
| 8 | June 23-27, 2014 | 8,111 | 1,622 | 0.90% |
| 9 | September 14-18, 2015 | 8,039 | 1,608 | 0.22% |
| 10 | August 25-29, 2016 | 8,021 | 1,604 | |
| June 20-24, 2016 (Surge 2) | 7,919 | 1,584 | ||
| July 5-8, 2016 (Surge 3)* | 6,278 | 1,570 |
*Only four days this week
Rosslyn Scott Street (Custis)
| Dates | Week Total | Daily Avg. | % Change Over Next Highest |
|
|---|---|---|---|---|
| 1 | June 6-10, 2016 (Surge 1) | 13,117 | 2,623 | 23.65% |
| 2 | June 13-17, 2016 (Surge 1) | 10,608 | 2,122 | 11.30% |
| 3 | July 11-15, 2016 (Surge 4) | 9,775 | 1,955 | 2.56% |
| 4 | May 11-15, 2016 | 9,531 | 1,906 | 0.85% |
| 5 | June 27-July 1, 2016 (Surge 2) | 9,451 | 1,890 | 0.40% |
| 6 | May 23-27, 2016 | 9,413 | 1,883 | 2.72% |
| 7 | June 2-6, 2014 | 9,164 | 1,833 | 0.01% |
| 8 | September 14-18, 2015 | 9,163 | 1,833 | 2.59% |
| 9 | July 28-August 1, 2014 | 8,932 | 1,786 | 0.16% |
| 10 | June 20-24, 2016 (Surge 2) | 8,918 | 1,784 | |
| July 5-8, 2016 (Surge 3)* | 7,118 | 1,780 |
*Only four days this week
Airport South (Mt. Vernon)
| Dates | Week Total | Daily Avg. | % Change Over Next Highest |
|
|---|---|---|---|---|
| 1 | June 6-10, 2016 (Surge 1) | 14,723 | 2,945 | 0.74% |
| 2 | July 11-15, 2016 (Surge 4) | 14,615 | 2,923 | 5.39% |
| 3 | July 5-8, 2016 (Surge 3)* | 11,094 | 2,774 | 1.45% |
| 4 | May 11-15, 2015 | 13,669 | 2,734 | 1.86% |
| 5 | May 25-29, 2015 | 13,419 | 2,684 | 2.91% |
| 6 | June 27-July 1, 2016 (Surge 2) | 13,040 | 2,608 | 0.99% |
| 7 | August 24-28, 2015 | 12,912 | 2,582 | 0.49% |
| 8 | August 25-29, 2014 | 12,849 | 2,570 | 0.25% |
| 9 | July 20-24, 2015 | 12,817 | 2,563 | 0.37% |
| 10 | July 28-August 1, 2014 | 12,770 | 2,554 | |
| June 13-17, 2016 (Surge 1) | 12,357 | 2,471 | ||
| June 20-24, 2016 (Surge 2) | 11,097 | 2,219 |
*Only four days this week
Bon Air West (W&OD)
| Dates | Week Total | Daily Avg. | % Change Over Next Highest |
|
|---|---|---|---|---|
| 1 | June 6-10, 2016 (Surge 1) | 11,878 | 2,376 | 22.35% |
| 2 | May 25-29, 2015 | 9,708 | 1,942 | 0.02% |
| 3 | June 2-6, 2014 | 9,706 | 1,941 | 0.42% |
| 4 | May 11-15, 2015 | 9,665 | 1,933 | 0.91% |
| 5 | June 13-17, 2016 (Surge 1) | 9,578 | 1,916 | 4.62% |
| 6 | May 23-27, 2016 | 9,155 | 1,831 | 0.02% |
| 7 | July 28-August 1, 2014 | 9,153 | 1,831 | 1.28% |
| 8 | June 23-27, 2014 | 9,037 | 1,807 | 0.07% |
| 9 | July 20-24, 2015 | 9,031 | 1,806 | 0.26% |
| 10 | August 25-29, 2014 | 9,008 | 1,802 | |
| June 27-July 1, 2016 (Surge 2) | 8,728 | 1,745 | ||
| July 11-15, 2016 (Surge 4) | 8,654 | 1,731 | ||
| July 5-8, 2016 (Surge 3)* | 6,442 | 1,611 | ||
| June 20-24, 2016 (Surge 2) | 7,847 | 1,569 |
*Only four days this week
Graph Data
Graph 1: Bike Counter Percentage Increase Over June 2015, Surge 1
| Counter | Surge 1, Week 1 | Surge 1, Week 2 |
|---|---|---|
| Bikeometer (Lynn & Lee Highway) | 73% | 39% |
| Custis Trail (Top of Rosslyn Hill) | 86% | 50% |
| Mount Vernon Trail (Airport South) | 42% | 19% |
| W&OD (Bon Air West) | 63% | 31% |
Graph 2: Bike Counter Percentage Increase Over June 2015, Surge 2
| Counter | Surge 2, Week 3 | Surge 2, Week 4 |
|---|---|---|
| Bikeometer (Lynn & Lee Highway) | 18% | 26% |
| Custis Trail (Top of Rosslyn Hill) | 26% | 34% |
| Mount Vernon Trail (Airport South) | 7% | 26% |
| W&OD (Bon Air West) | 8% | 20% |
Graph 3: Bike Counter Percentage Increase Over June 2015, Surges 3 and 4
| Counter | Surge 3, Week 5 | Surges 3-4, Week 6 |
|---|---|---|
| Bikeometer (Lynn & Lee Highway) | 11% | 21% |
| Custis Trail (Top of Rosslyn Hill) | 17% | 29% |
| Mount Vernon Trail (Airport South) | 21% | 28% |
| W&OD (Bon Air West) | 2% | 9% |
Graph 4: Bike Counter Percentage Increase Over June 2015, Weeks 1-6 of SafeTrack
| Counter | Week 1 | Week 2 | Week 3 | Week 4 | Week 5 | Week 6 |
|---|---|---|---|---|---|---|
| Bikeometer (Lynn & Lee Highway) | 73% | 39% | 18% | 26% | 11% | 21% |
| Custis Trail (Top of Rosslyn Hill) | 86% | 50% | 26% | 34% | 17% | 29% |
| Mount Vernon Trail (Airport South) | 42% | 19% | 7% | 26% | 21% | 28% |
| W&OD (Bon Air West) | 63% | 31% | 8% | 20% | 2% | 9% |
Comments are closed here.
To prevent spam, comments will be approved before appearing on the post. If you have a comment or question, but do not want it to be published, please email BikeArlington.